Temperature averages sound straightforward. You add numbers up, divide by how many there are, done. And sometimes that’s exactly right. But depending on what you’re calculating daily temperature, monthly climate data, average temperature across a region, or the mean temperature of a surface the method changes. And using the wrong one gives you a number that looks correct but means something different from what you intended. So here’s how to calculate average temperature properly, across every context you’re likely to need it.

Table of Contents
The Basic Formula — And When It’s Enough
The standard way to calculate average temperature is the arithmetic mean. Add all your temperature readings together and divide by the number of readings.
Formula:
Average Temperature = Sum of All Temperatures ÷ Number of Readings
Example: You record temperatures across five days: 18°C, 21°C, 19°C, 24°C, 22°C
Sum = 18 + 21 + 19 + 24 + 22 = 104 Number of readings = 5 Average = 104 ÷ 5 = 20.8°C
That’s how to calculate average temperature for a simple dataset. Equal readings taken at equal time intervals, same location, same measurement method. The arithmetic mean works perfectly here. Where it gets more complicated is when your readings aren’t equal in weight different time intervals, different altitudes, different surface areas, or readings that need to represent different things. That’s where the method needs to adjust.
Why Your Daily Temperature Average Isn’t As Simple As It Looks
Most weather apps and meteorological agencies don’t just take the midday reading and call it the daily average. They use a specific method — and there are actually a few different ones depending on the country and the purpose.
Method 1 — The Two-Reading Method: Take the day’s maximum temperature and minimum temperature, add them together, divide by two.
Daily Average = (Maximum Temp + Minimum Temp) ÷ 2
This is the most common method used in weather reporting. It’s fast, consistent, and works well for most practical purposes.
Example: Max temp = 29°C, Min temp = 15°C Average = (29 + 15) ÷ 2 = 22°C
Method 2 — The Multi-Reading Method: Take readings at regular intervals throughout the day — every hour or every three hours — add them all up and divide by the number of readings. This gives a more accurate picture because it captures temperature peaks and drops throughout the day rather than just the endpoints.
Weather stations recording hourly data use 24 readings per day:
Daily Average = Sum of 24 hourly readings ÷ 24
Method 3 — The Observation Method: Some older weather records used three or four readings taken at specific times (typically 7am, 2pm, 9pm) and applied weighting to account for the unequal time gaps. You won’t need this unless you’re working with historical meteorological data, but it explains why different databases sometimes show slightly different averages for the same location and period.

How to Calculate Average Temperature for a Week or Month
Once you have daily averages, calculating a weekly or monthly average is the same arithmetic mean process applied one level up.
Weekly Average: Add the seven daily average temperatures together and divide by 7.
Weekly Average = Sum of 7 Daily Averages ÷ 7
Monthly Average: Add all daily averages for that month and divide by the number of days in the month.
Monthly Average = Sum of Daily Averages ÷ Number of Days in Month
Example for a 5-day period:
| Day | Max | Min | Daily Average |
|---|---|---|---|
| Monday | 26°C | 14°C | 20°C |
| Tuesday | 28°C | 16°C | 22°C |
| Wednesday | 22°C | 12°C | 17°C |
| Thursday | 24°C | 13°C | 18.5°C |
| Friday | 30°C | 17°C | 23.5°C |
Weekly Average = (20 + 22 + 17 + 18.5 + 23.5) ÷ 5 = 101 ÷ 5 = 20.2°C
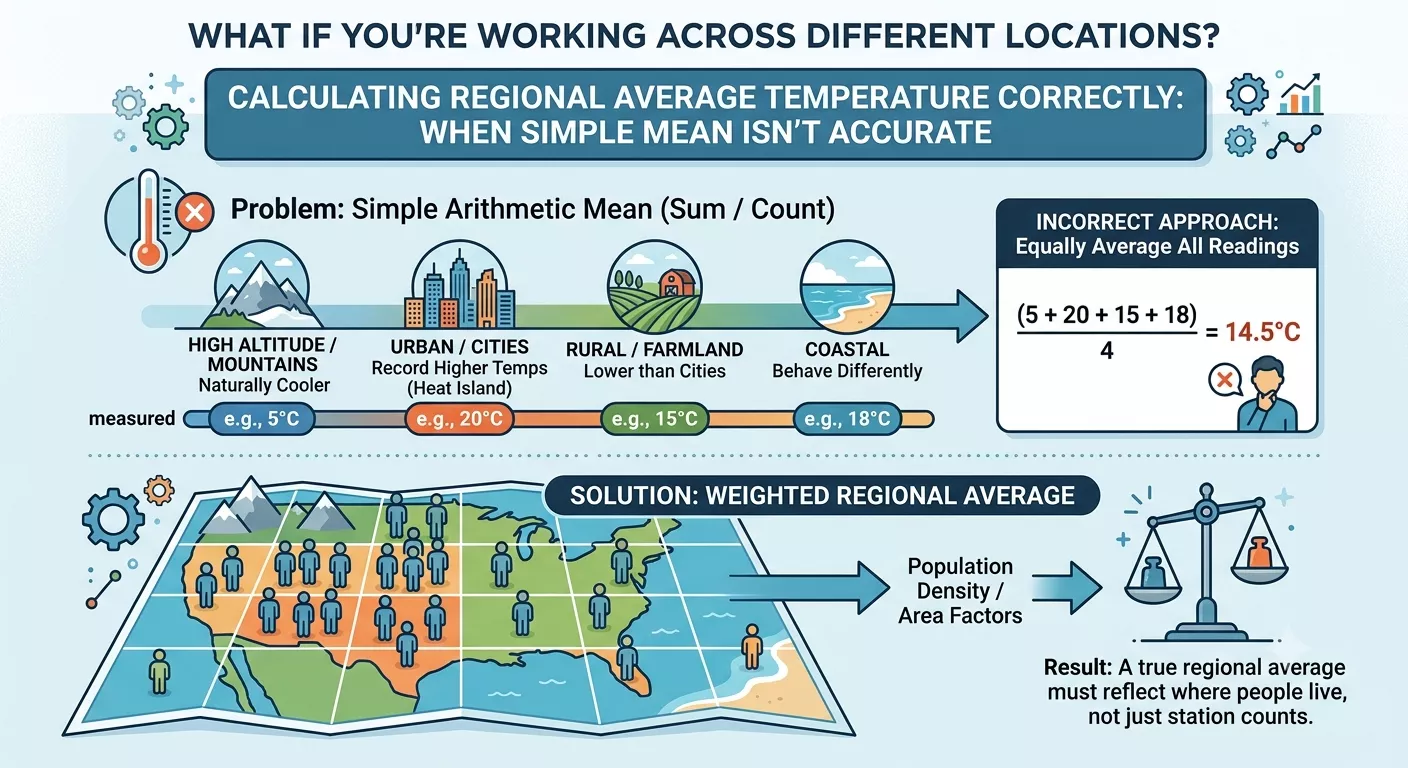
What If You’re Working Across Different Locations?
This is where knowing how to calculate average temperature correctly gets more important. If you have temperature readings from multiple weather stations or multiple locations and you want to calculate a regional average, simple arithmetic mean isn’t always accurate. Stations at higher altitudes naturally record lower temperatures. Stations in cities record higher temperatures than rural stations nearby. Coastal stations behave differently from inland ones. When you average those readings equally, the result can be misleading a handful of high-altitude mountain stations can pull the regional average down even if 90% of the population lives at low altitude. Also Read: How to Calculate Fahrenheit to Celsius?
The weighted average method solves this:
Weighted Average = (T1 × W1) + (T2 × W2) + … ÷ (W1 + W2 + …)
Where T is the temperature reading and W is the weight assigned to that reading (based on area covered, population, or another relevant factor).
Simple example: Station A (covers 70% of region): 24°C Station B (covers 30% of region): 16°C
Weighted Average = (24 × 0.7) + (16 × 0.3) = 16.8 + 4.8 = 21.6°C
Simple average would have given you (24 + 16) ÷ 2 = 20°C — a full 1.6 degrees lower, which matters in climate analysis.

Celsius vs Fahrenheit — Does the Method Change?
No. The formula for how to calculate average temperature is identical regardless of which unit you’re using. You’re always adding values and dividing by the count.
What changes is the conversion if you need to report in a different unit.
Celsius to Fahrenheit:
°F = (°C × 9/5) + 32
Fahrenheit to Celsius:
°C = (°F − 32) × 5/9
Important: Convert individual readings to the same unit before averaging. Don’t average in mixed units and then convert — the result will be wrong. Wrong method: Average 20°C and 68°F directly these aren’t the same temperature (68°F = 20°C, but that’s a coincidence mixing 20°C and 50°F would give you a wrong average). Right method: Convert all readings to the same unit first, then calculate the average, then convert the result if needed. Also Read: How do you Calculate Yield Percentage in simple terms
How Science and Engineering Use Temperature Averages Differently
Standard temperature averaging works for weather and everyday use. But in engineering, physics, and some scientific applications, temperature averages work differently because temperature doesn’t always scale linearly with energy.
Root Mean Square (RMS) Temperature: Used in thermal engineering when calculating heat transfer or radiation effects. It gives more weight to higher temperatures because radiation effects scale with the fourth power of temperature (Stefan-Boltzmann law).
RMS Temperature = √[(T1² + T2² + T3² + …) ÷ n]
Logarithmic Mean Temperature Difference (LMTD): Used in heat exchanger design to calculate the effective temperature difference driving heat transfer between two fluids.
LMTD = (ΔT1 − ΔT2) ÷ ln(ΔT1/ΔT2)
These aren’t needed for weather calculations or everyday temperature tracking. But if you’re an engineering student or working in thermal systems — knowing that a simple arithmetic mean isn’t always the right approach for temperature in technical contexts saves you from getting the wrong answer on something that matters.
Step-by-Step: How to Calculate Average Temperature in Five Minutes
Here’s the practical walkthrough for the most common use case — calculating average temperature from a set of daily readings.
Step 1 — Collect your readings. Write down every temperature reading you have. Make sure they’re all in the same unit (all Celsius or all Fahrenheit).
Step 2 — Add them all together. Sum every reading in your dataset.
Step 3 — Count the number of readings. Count how many individual readings you added up.
Step 4 — Divide the sum by the count. Sum ÷ Count = Average Temperature.
Step 5 — Label the result. Write the unit next to your answer. 22°C and 22°F are completely different temperatures. Always label it.
Quick example — 7 days of readings in Celsius:
14, 17, 20, 18, 22, 19, 16
Sum = 14 + 17 + 20 + 18 + 22 + 19 + 16 = 126 Count = 7 Average = 126 ÷ 7 = 18°C
Common Mistakes When Calculating Average Temperature
Mixing units. Already covered this but it’s the most common error and it always produces a wrong answer. Convert everything to one unit before you start.
Using the wrong number of readings. If you collected 30 days of data but accidentally counted 31 — your average is off. Count the readings, not the assumed period.
Treating a missing day as zero. If you didn’t record a temperature on Wednesday, that day’s reading is missing — not zero. Zero degrees is a real temperature. A missing value should either be estimated or excluded from the count entirely. Including it as zero will pull your average down significantly.
Averaging averages without weighting. If you have monthly averages and want a yearly average — you can’t just add 12 monthly averages and divide by 12 if some months have 28 days and others have 31. Weight the monthly averages by the number of days in each month:
Annual Average = Sum of (Monthly Average × Days in Month) ÷ 365
Example: January average: 8°C × 31 days = 248 February average: 9°C × 28 days = 252 …and so on through December, then divide the total by 365.
Quick Reference Table — Which Method to Use When
| Situation | Method | Formula |
|---|---|---|
| Daily average from max/min | Two-reading method | (Max + Min) ÷ 2 |
| Daily average from hourly data | Arithmetic mean | Sum of readings ÷ 24 |
| Weekly average | Arithmetic mean | Sum of daily averages ÷ 7 |
| Monthly average | Arithmetic mean | Sum of daily averages ÷ days in month |
| Regional average (multiple stations) | Weighted average | (T × W) summed ÷ total weight |
| Annual average from monthly data | Weighted by days | (Monthly avg × days) summed ÷ 365 |
| Heat transfer engineering | RMS or LMTD | See engineering formulas above |
Knowing how to calculate average temperature correctly depends on what you’re trying to measure and how precise you need to be. For everyday purposes a week’s weather, a school project, monthly climate tracking the arithmetic mean with max and min readings works perfectly. For regional analysis, climate research, or engineering applications, weighted averages or more specialized methods give you numbers that actually mean what you think they mean. Get the method right first. The math itself is simple once you do.